Simpler Workflows—Better Reports—and a Reimagined Developer Experience
Optimizing data workflows, enhancing executive reporting, and transforming the developer experience.
Client: JPMorgan Chase & Co
Proposition: Digital Transformation
Industry: Fintech
Team & Timeframe:
Over a 12-month engagement, I collaborated closely with business stakeholders and subject matter experts to deeply understand their transformation goals within corporate investment banking. Additionally, I led external design teams and built autonomous, high-performing product teams to drive impactful outcomes.
Key Activities:
Developing experience strategies.
Creating and testing rapid prototypes.
Designing information architecture.
Creating interaction models.
Analyzing and improving workflows.
Conceptualizing product designs.
RESULTS
40% DAU
Increaseded on the developer portal, enabling product and service creation for developer communities.
98%
Efficiency improvement by developing and demonstrating a POC that reduced a task from requiring two people over two weeks to just one person in one hour.
Being a trusted partner for clients
Enhance idea generation, iterate faster, and deliver digitally
At JPMorgan, the core principles of investment banking remain steadfast: acting as a trusted partner to their clients, offering best-in-class advisory services, ensuring flawless execution, and attracting and retaining exceptional talent. With their clients serving as the catalysts for innovation, they were committed to enhancing idea generation, accelerating iteration, and delivering digitally-driven solutions. Achieving this vision required reimagining workflows to unlock greater value for shareholders, deepen wallet share with existing clients, and expand capacity to seize new opportunities.
Problem Space No. 1—Business banking executives faced significant barriers in accessing and utilizing treasury analytics to drive informed decision-making. Fragmented data architectures, disparate systems, and siloed processes hindered their ability to deliver actionable insights, optimize treasury products, and improve customer outcomes.
Figure 1:
Understanding Data Architecture From the End-Users Perspective

Objective—Streamline the process for bankers to aggregate key metrics and customer usage data across products and services. In the current state, this process involves manually analyzing data from four disparate systems, reconciling inconsistencies, and creating a report to inform business discussions. The goal is to automate this workflow, reducing manual effort and enabling faster, more accurate insights to drive strategic conversations.
Treasury Insights Outcome—There was a significant reduction in manual effort, which led to increased efficiency and productivity for bankers. This enabled them to generate reports faster, with fewer errors, and freed up time to focus on higher-value tasks. The automation also provided more accurate and timely insights, empowering business leaders to make data-driven decisions and engage in strategic discussions with greater confidence and agility. Additionally, streamlining the workflow improved collaboration across teams and enhanced the overall customer experience by enabling more personalized and informed interactions.
Solution—Our first step was to assess the various data systems and their limitations, with the understanding that no investment would be made in migrating or changing the underlying systems supporting the current data. Given this constraint, one of our initial decisions was to implement data virtualization as middleware. This approach allowed us to clean and aggregate the data after it was sourced, while also customizing the presentation layer to meet the specific needs of the users.
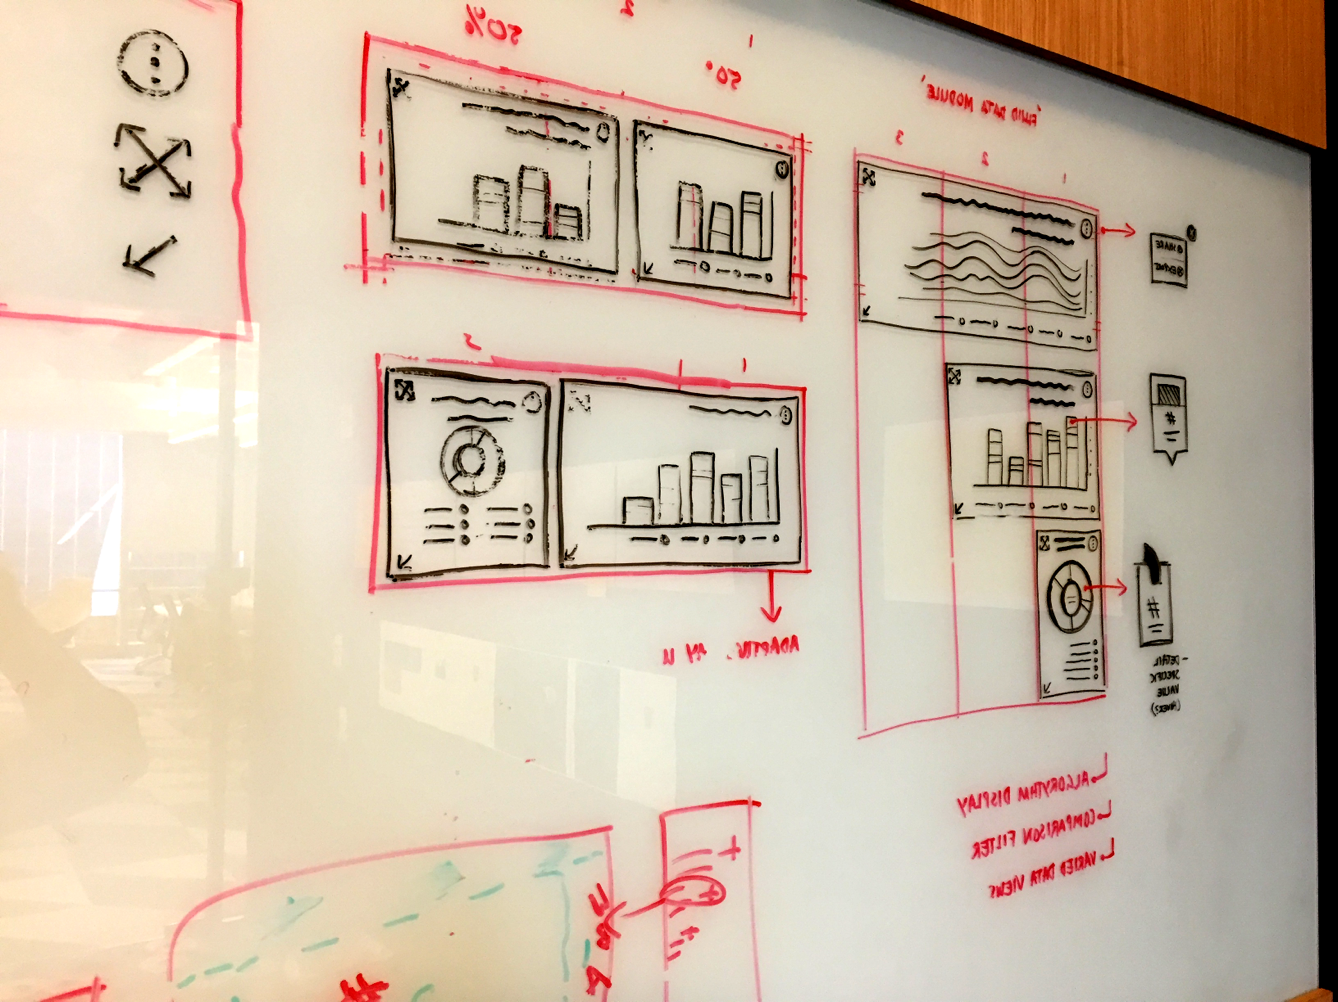
Figure 1.2—We then collaborated with bankers to understand the priorities for how end-users would assess and analyze the data. At this stage, it became clear that the data needed to be viewed through three key dimensions: first, a high-level overview of product, service, and technology metrics; second, a progressive disclosure of product usage incident tickets, categorized by priority and ownership; and third, the ability to drill down and dissect specific data sets for deeper analysis.
Figure 1.2:
Co-Design Collaboration

MORE RESULTS—


